二进制安装prometheus,并使用node- export对两台服务器进行监控
1.什么是prometheus?
Prometheus是由SoundCloud开发的开源监控报警系统和时序列数据库(TSDB)。Prometheus使用Go语言开发,是Google BorgMon监控系统的开源版本。 2016年由Google发起Linux基金会旗下的原生云基金会(Cloud Native Computing Foundation), 将Prometheus纳入其下第二大开源项目。 Prometheus目前在开源社区相当活跃。 Prometheus和Heapster(Heapster是K8S的一个子项目,用于获取集群的性能数据。)相比功能更完善、更全面。Prometheus性能也足够支撑上万台规模的集群。简单来说prometheus就是用来数据收集和存储的,使用的pull模式。
1.1.prometheus的特点
- 多维度数据模型
- 灵活的查询语言
- 不依赖分布式存储,单个服务器节点是自主的
- 通过基于HTTP的pull方式采集时序数据
- 可以通过中间网关进行时序列数据推送
- 通过服务发现或者静态配置来发现目标服务对象
- 支持多种多样的图表和界面展示,比如Grafana等
1.2.基本原理
通过HTTP协议周期性抓取被监控组件的状态,任意组件只要提供对应的HTTP接口就可以接入监控。不需要任何SDK或者其他的集成过程。这样做非常适合做虚拟化环境监控系统,比如VM、Docker、Kubernetes等。输出被监控组件信息的HTTP接口被叫做exporter 。目前互联网公司常用的组件大部分都有exporter可以直接使用,比如Varnish、Haproxy、Nginx、MySQL、Linux系统信息(包括磁盘、内存、CPU、网络等等)。
1.3.服务过程
Prometheus Daemon负责定时去目标上抓取metrics(指标)数据,每个抓取目标需要暴露一个http服务的接口给它定时抓取。Prometheus支持通过配置文件、文本文件、Zookeeper、Consul、DNS SRV Lookup等方式指定抓取目标。Prometheus采用PULL的方式进行监控,即服务器可以直接通过目标PULL数据或者间接地通过中间网关来Push数据
Prometheus在本地存储抓取的所有数据,并通过一定规则进行清理和整理数据,并把得到的结果存储到新的时间序列中
Prometheus通过PromQL和其他API可视化地展示收集的数据。Prometheus支持很多方式的图表可视化,例如Grafana、自带的Promdash以及自身提供的模版引擎等等。Prometheus还提供HTTP API的查询方式,自定义所需要的输出
PushGateway支持Client主动推送metrics到PushGateway,而Prometheus只是定时去Gateway上抓取数据
Alertmanager是独立于Prometheus的一个组件,可以支持Prometheus的查询语句,提供十分灵活的报警方式
1.4.三大套件
- Server 主要负责数据采集和存储,提供PromQL查询语言的支持
- Alertmanager 警告管理器,用来进行报警
- Push Gateway 支持临时性Job主动推送指标的中间网关
1.5.node_export
node_export是什么
node-export 主要主要是监控kubernetes 集群node 物理主机:cpu、memory、network、disk 等基础监控资源。 node_export是一个监控服务会暴露一个接口,prometheus通过这个接口获取数据。
2.搭建过程
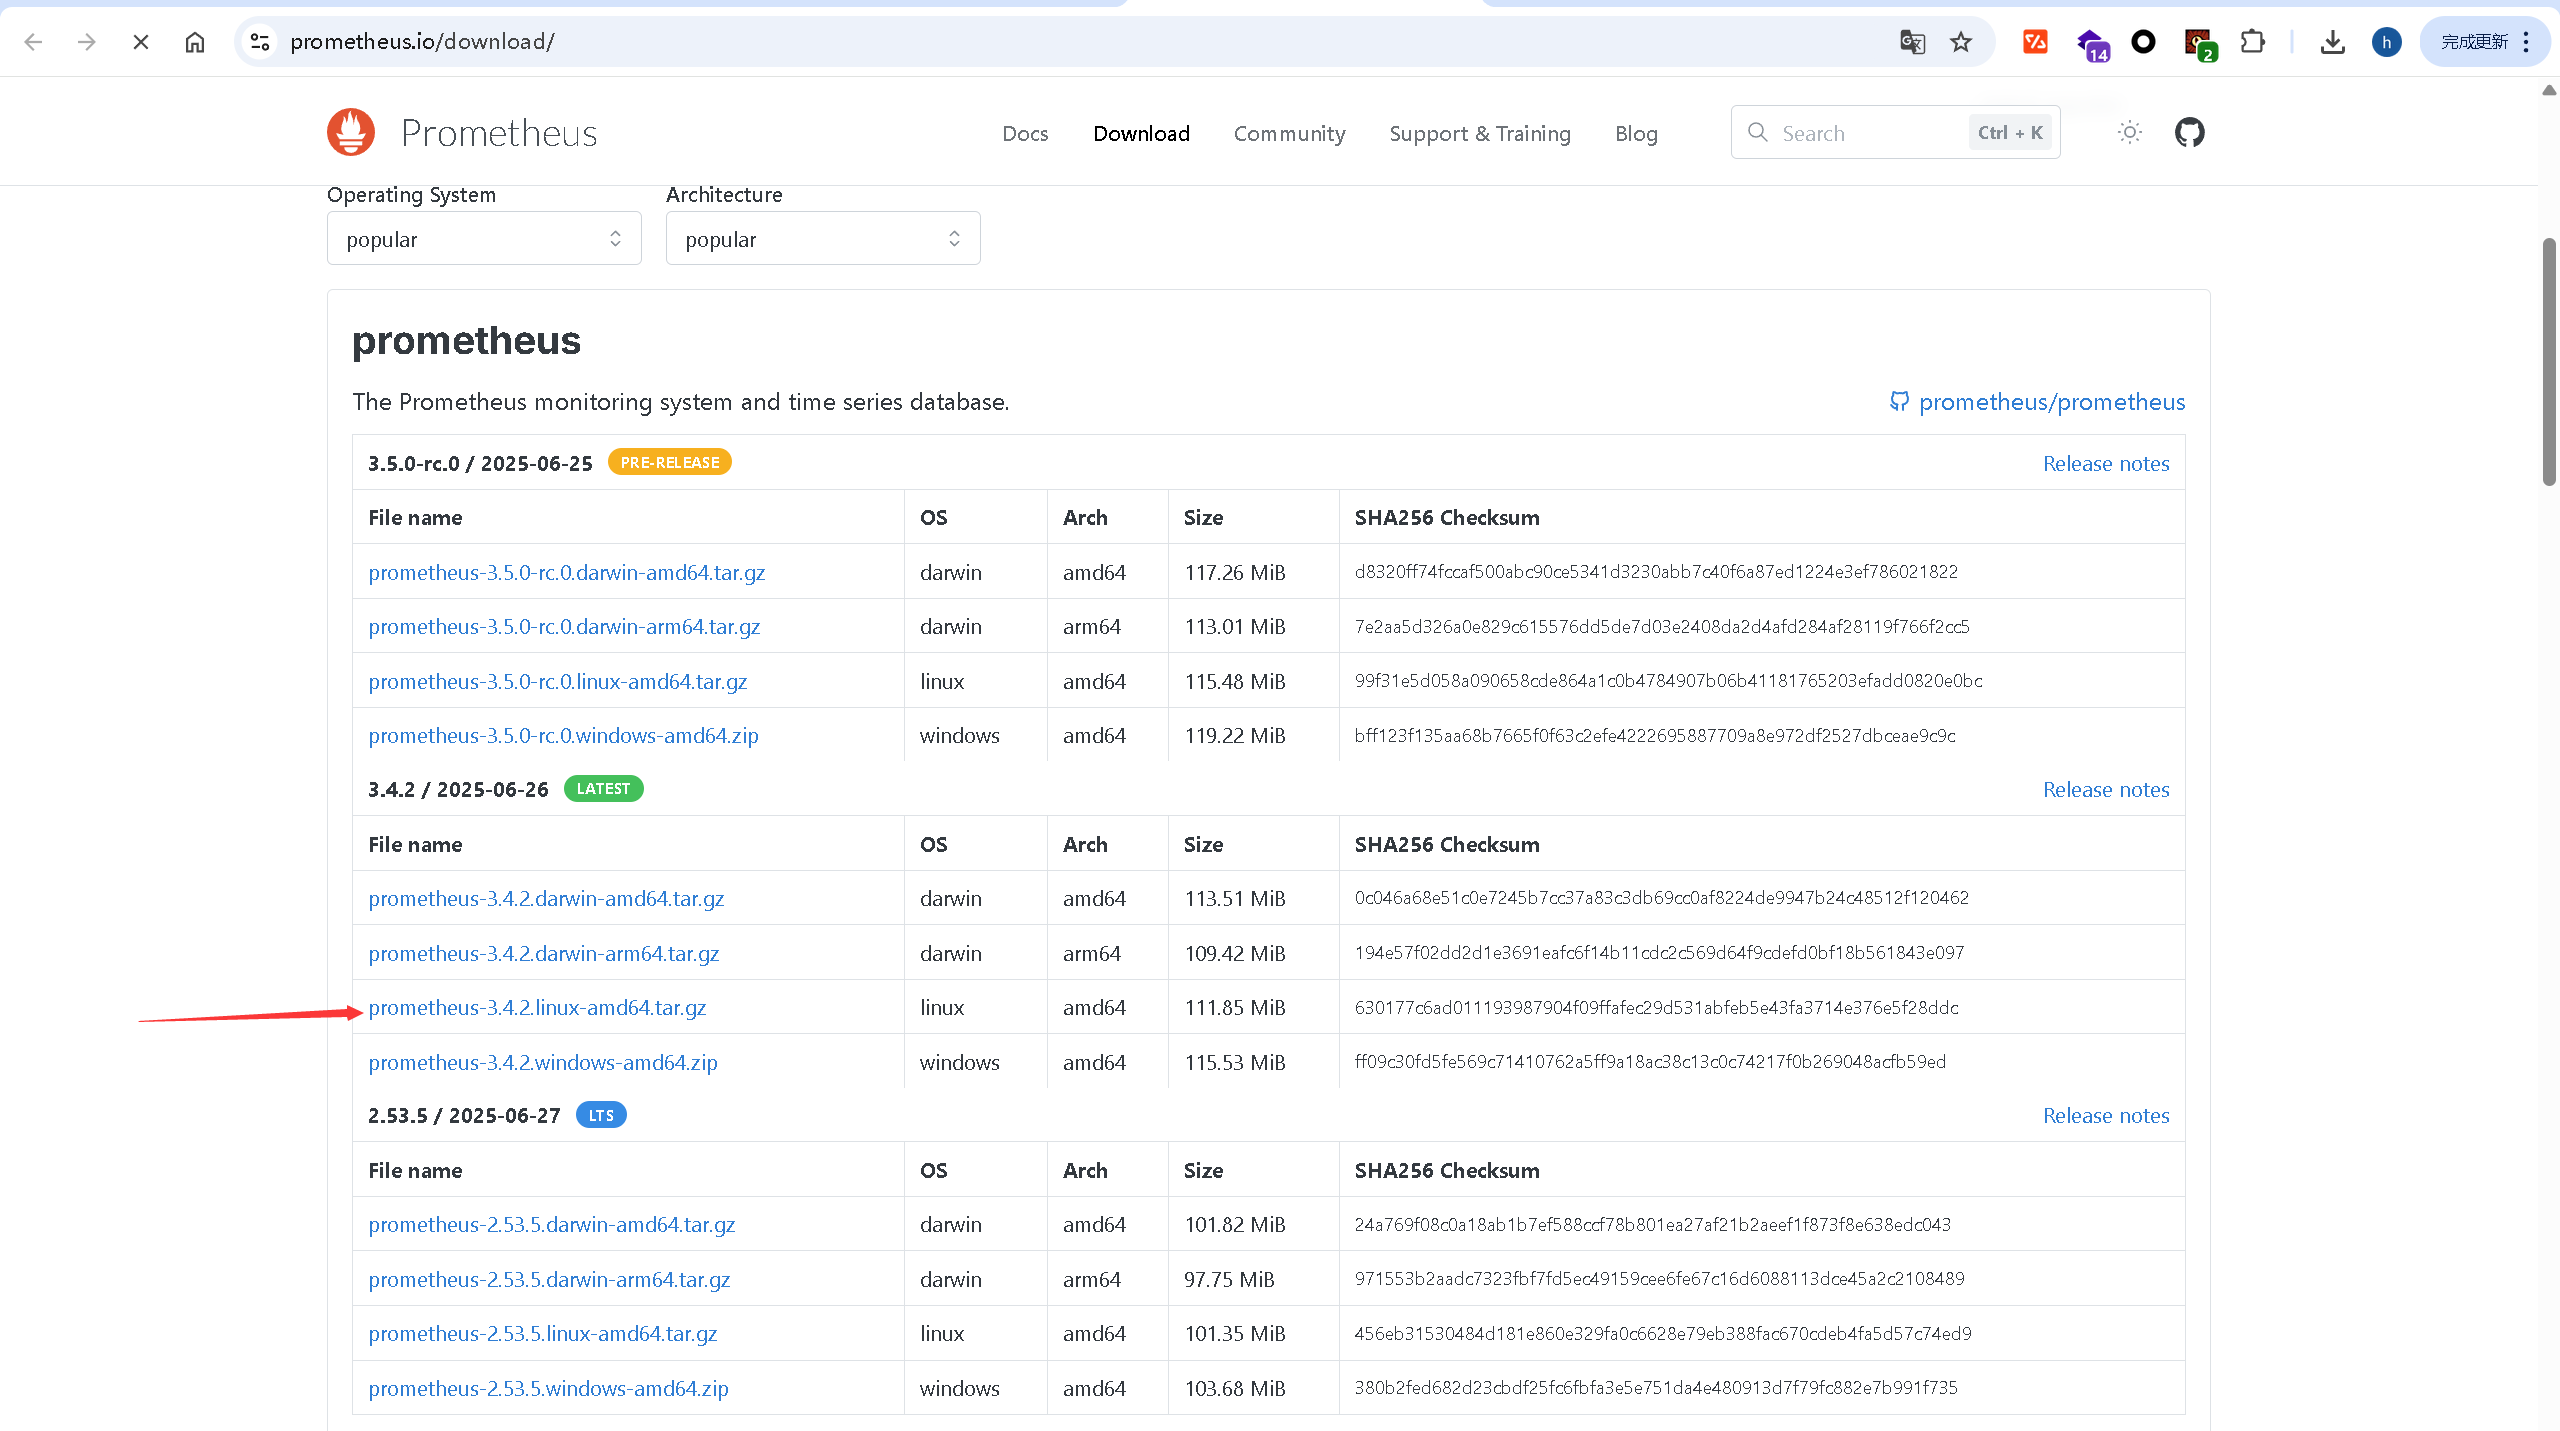
2.1.在官网下载预编译二进制安装包
2.2.创建目录
# 创建目录并切换
[root@nginx1 prometheus]# mkdir /wwq/packages/prometheus
[root@nginx1 prometheus]# cd /wwq/packages/prometheus/
随后通过xshell传入虚拟机中

2.3.用户和组
#先检查用户prometheus和组prometheus是否存在

#检查组是否存在
[root@nginx1 prometheus]# cat /etc/group | grep prometheus

#如果不存在,创建组
[root@nginx1 prometheus]# groupadd prometheus

#检查用户prometheus是否存在
[root@nginx1 prometheus]# cat /etc/passwd | grep prometheus
或者
id prometheus

#如果不存在,创建用户
[root@nginx1 prometheus]# useradd -g prometheus prometheus
2.4.解压
[root@nginx1 prometheus]# tar -xzvf prometheus-3.4.2.linux-amd64.tar.gz
2.5.为prometheus创建配置文件目录和存放数据目录并赋权限
# 为prometheus创建存放配置文件的目录
[root@nginx1 prometheus]# mkdir /etc/prometheus

# 为prometheus创建存放数据的目录
[root@nginx1 prometheus]# mkdir -p /wwq/data/prometheus

# 为/var/lib/prometheus目录设置权限
[root@nginx1 prometheus]# chown prometheus.prometheus /wwq/data/prometheus/
[root@nginx1 prometheus]# ll /wwq/data/ | grep prometheus
drwxr-xr-x. 2 prometheus prometheus 6 7月   2 15:37 prometheus
2.6.将prometheus配置文件拷贝到/etc/prometheus目录下
[root@nginx1 prometheus]# cd prometheus-3.4.2.linux-amd64/
[root@nginx1 prometheus-3.4.2.linux-amd64]# cp prometheus.yml /etc/prometheus/
2.7.将prometheus下二进制文件拷贝到/usr/local/bin目录下
#将 Prometheus 的二进制(例如 prometheus 和 promtool)文件拷贝到 /usr/local/bin/ 是为了让它们在系统的任意位置都能直接运行,而无需进入具体目录。
[root@nginx1 prometheus-3.4.2.linux-amd64]# cp prometheus /usr/local/bin/
[root@nginx1 prometheus-3.4.2.linux-amd64]# cp promtool /usr/local/bin/
[root@nginx1 prometheus-3.4.2.linux-amd64]# ll /usr/local/bin/ | grep prom
-rwxr-xr-x. 1 root root 154791308 7月   2 16:01 prometheus
-rwxr-xr-x. 1 root root 146208440 7月   2 16:01 promtool
2.8.修改配置文件
[root@nginx1 prometheus-3.4.2.linux-amd64]# cat /etc/prometheus/prometheus.yml
# my global config
global:
  scrape_interval: 15s # Set the scrape interval to every 15 seconds. Default is every 1 minute.
  evaluation_interval: 15s # Evaluate rules every 15 seconds. The default is every 1 minute.
  # scrape_timeout is set to the global default (10s).

# Alertmanager configuration
alerting:
  alertmanagers:
    - static_configs:
        - targets:
          # - alertmanager:9093

# Load rules once and periodically evaluate them according to the global 'evaluation_interval'.
rule_files:
  # - "first_rules.yml"
  # - "second_rules.yml"

# A scrape configuration containing exactly one endpoint to scrape:
# Here it's Prometheus itself.
scrape_configs:
  # The job name is added as a label `job=<job_name>` to any timeseries scraped from this config.
  - job_name: "prometheus"

    # metrics_path defaults to '/metrics'
    # scheme defaults to 'http'.

    static_configs:
      - targets: ["localhost:9090"]
       # The label name is added as a label `label_name=<label_value>` to any timeseries scraped from this config.
        labels:
          app: "prometheus"
因为默认的配置文件中已经有prometheus自身的配置信息了,所以这里无需修改。
2.9.启动prometheus
# 可直接启动(非后台启动),进入prometheus安装目录
./prometheus

# 后台启动,在安装目录下:
nohup ./prometheus --config.file=prometheus.yml --web.enable-admin-api --web.listen-address=:9090 >/dev/null 2>&1 &

# 后台启动,在任意目录下:
nohup /usr/local/prometheus/prometheus --config.file=/etc/prometheus/prometheus.yml --web.enable-admin-api --web.listen-address=:9090 >/dev/null 2>&1 &

我们这里使用后台启动。
[root@nginx1 prometheus-3.4.2.linux-amd64]# nohup /wwq/packages/prometheus/prometheus-3.4.2.linux-amd64/prometheus  --config.file=/etc/prometheus/prometheus.yml  --web.enable-admin-api  --web.listen-address=:9090 > /wwq/logs/prometheus.log 2>&1 &
[1] 94763

# 查看是否存在prometheus进程
[root@nginx1 prometheus-3.4.2.linux-amd64]# ps aux | grep prometheus
root      94863  0.2  2.3 1335452 44536 pts/2   Sl   16:25   0:00 /wwq/packages/prometheus/prometheus-3.4.2.linux-amd64/prometheus --config.file=/etc/prometheus/prometheus.yml --web.enable-admin-api --web.listen-address=:9090
root      94935  0.0  0.0 112824   980 pts/2    S+   16:26   0:00 grep --color=auto prometheus

# 查看9090端口是否被监听
[root@nginx1 prometheus-3.4.2.linux-amd64]# netstat -tunlp | grep :9090
tcp6       0      0 :::9090                 :::*                    LISTEN      94863/prometheus
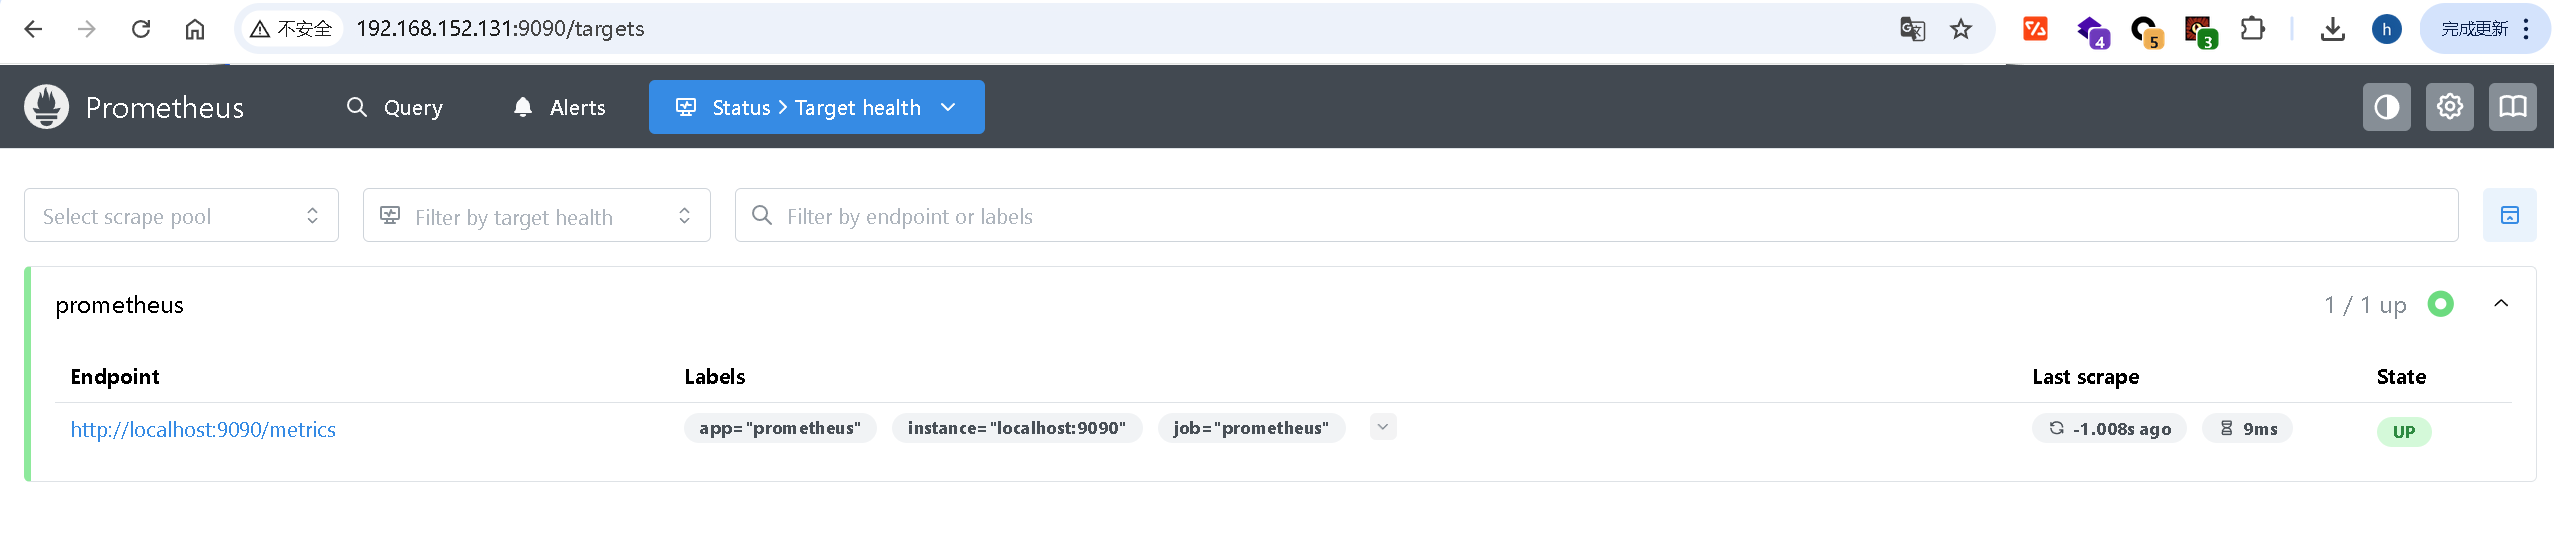
启动成功后,浏览器访问ip:9090,我们这里是http://192.168.152.131:9090
2.10.防火墙配置(本机省略)
因为这里是本机测试,所以防火墙是关闭状态,正常情况下服务器的防火墙都是开启的,所以需要做这一步配置,把9090端口加入防火墙。
# 把9090端口加入防火墙
[root@nginx1 prometheus-2.23.0.linux-amd64]# firewall-cmd --add-port=9090/tcp --permanent
success

# 重载防火墙的修改
[root@nginx1 prometheus-2.23.0.linux-amd64]# firewall-cmd --reload
success
2.11.将prometheus加入systemctl管理
创建prometheus.service服务文件
[root@nginx1 prometheus-3.4.2.linux-amd64]# vim /etc/systemd/system/prometheus.service

[Unit]
Description=Prometheus Monitoring System
Wants=network-online.target
After=network-online.target

[Service]
User=prometheus
Group=prometheus
Type=simple
ExecStart=/wwq/packages/prometheus/prometheus-3.4.2.linux-amd64/prometheus
  --config.file=/etc/prometheus/prometheus.yml
  --storage.tsdb.path=/wwq/data/prometheus
  --web.console.templates=/wwq/packages/prometheus/prometheus-3.4.2.linux-amd64/consoles
  --web.console.libraries=/wwq/packages/prometheus/prometheus-3.4.2.linux-amd64/console_libraries

Restart=always
RestartSec=3
LimitNOFILE=65536
PrivateTmp=true

[Install]
WantedBy=multi-user.target
| 参数 | 作用 |
|---|---|
--config.file=/etc/prometheus/prometheus.yml |
指定配置文件位置 |
--storage.tsdb.path=/wwq/data/prometheus |
指定存储时序数据库数据的路径 |
--web.console.templates=... |
设置 Web 控制台使用的模板路径 |
--web.console.libraries=... |
设置 Web 控制台使用的库路径 |
2.12.重新加载服务列表
[root@nginx1 prometheus-3.4.2.linux-amd64]# systemctl daemon-reload
2.13.结束原来的进程 重启服务
[root@nginx1 prometheus-3.4.2.linux-amd64]# kill -9 94863
[root@nginx1 prometheus-3.4.2.linux-amd64]# systemctl start prometheus
[2]+ 已杀死 nohup /wwq/packages/prometheus/prometheus-3.4.2.linux-amd64/prometheus --config.file=/etc/prometheus/prometheus.yml --web.enable-admin-api --web.listen-address=:9090 > /wwq/logs/prometheus.log 2>&1
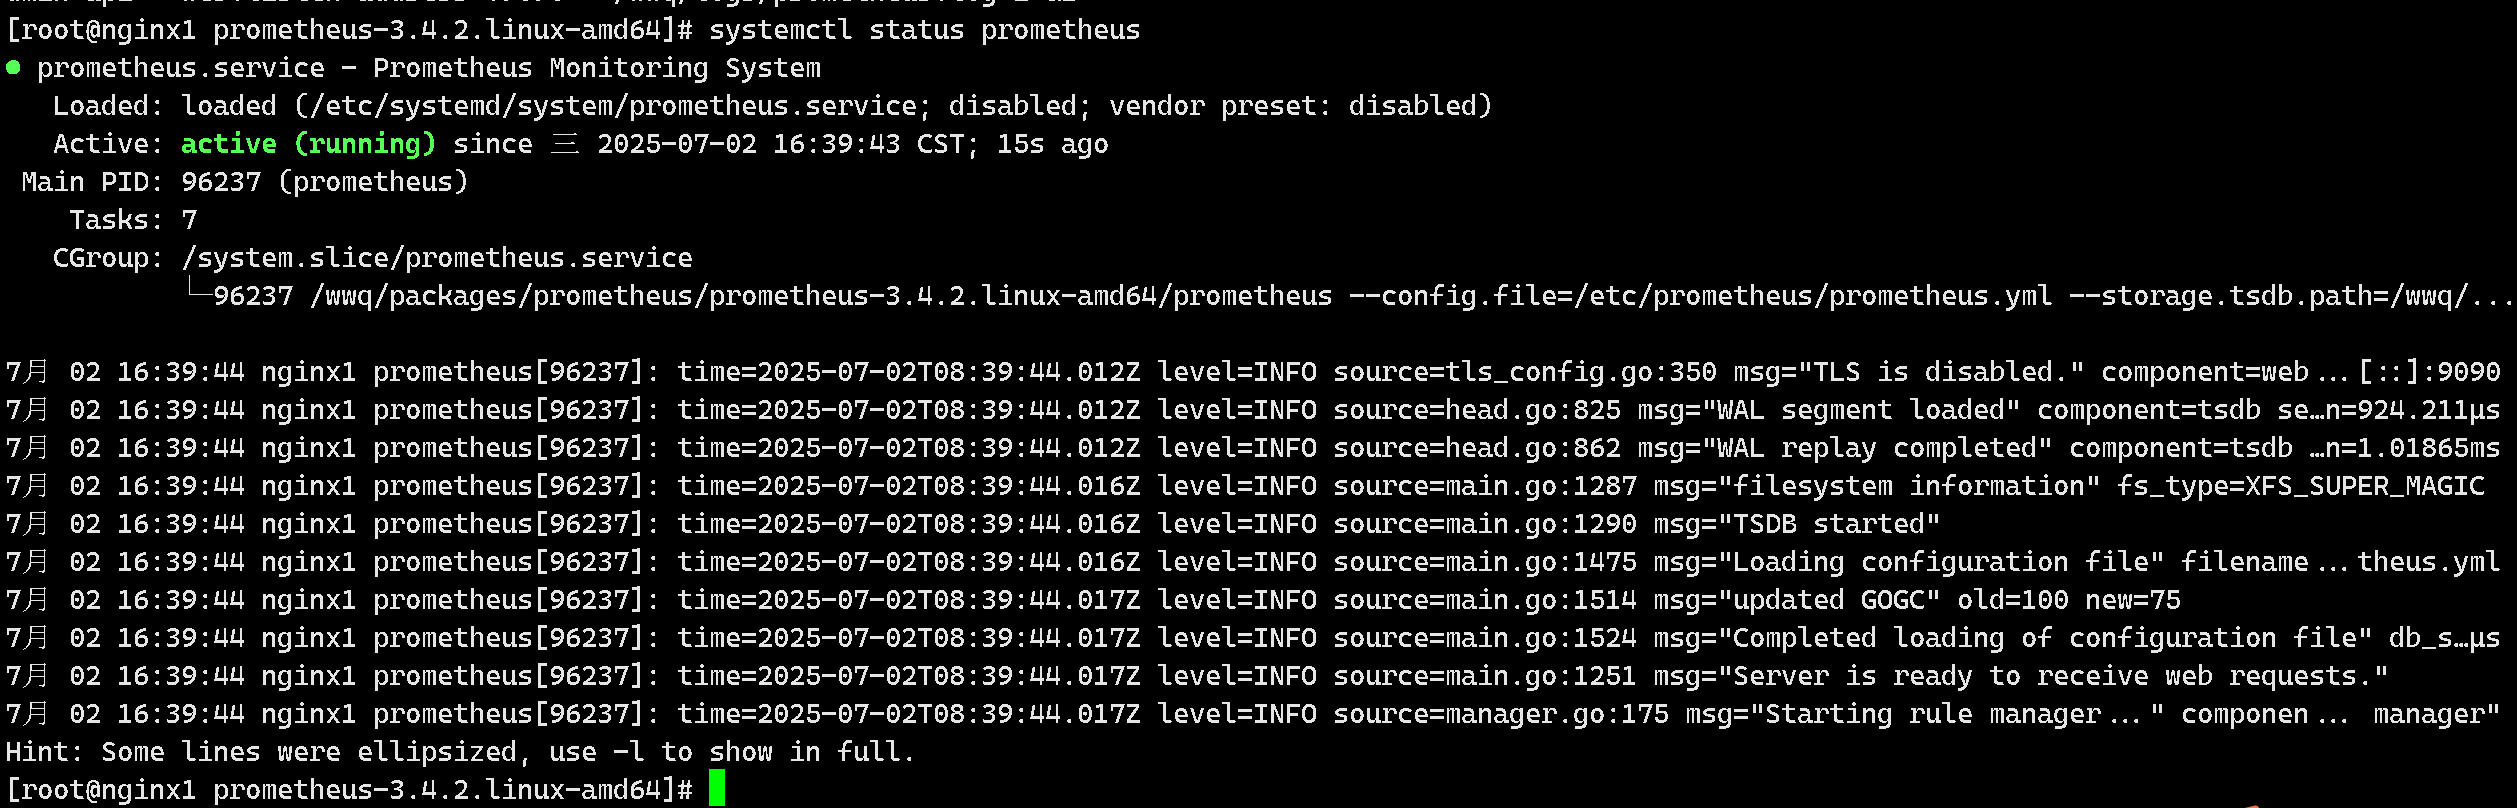
[root@nginx1 prometheus-3.4.2.linux-amd64]# systemctl status prometheus
2.14.设置开机自启动
[root@nginx1 node_exporter-1.9.1.linux-amd64]# systemctl enable prometheus
2.15.node_exporter的安装和使用
用户和组
#先检查用户node_exporter和组node_exporter是否存在

#检查组是否存在
cat /etc/group | grep node_exporter

#如果不存在,创建组
[root@nginx1 prometheus-3.4.2.linux-amd64]# groupadd node_exporter

#检查用户node_exporter是否存在
[root@nginx1 prometheus-3.4.2.linux-amd64]# cat /etc/passwd | grep node_exporter
或者
id node_exporter

#如果不存在,创建用户
[root@nginx1 prometheus-3.4.2.linux-amd64]# useradd -g node_exporter node_exporter
创建目录
# 创建目录并切换
[root@nginx1 prometheus-3.4.2.linux-amd64]# mkdir -p /wwq/packages/node_exporter
[root@nginx1 prometheus-3.4.2.linux-amd64]# cd /wwq/packages/node_exporter
下载
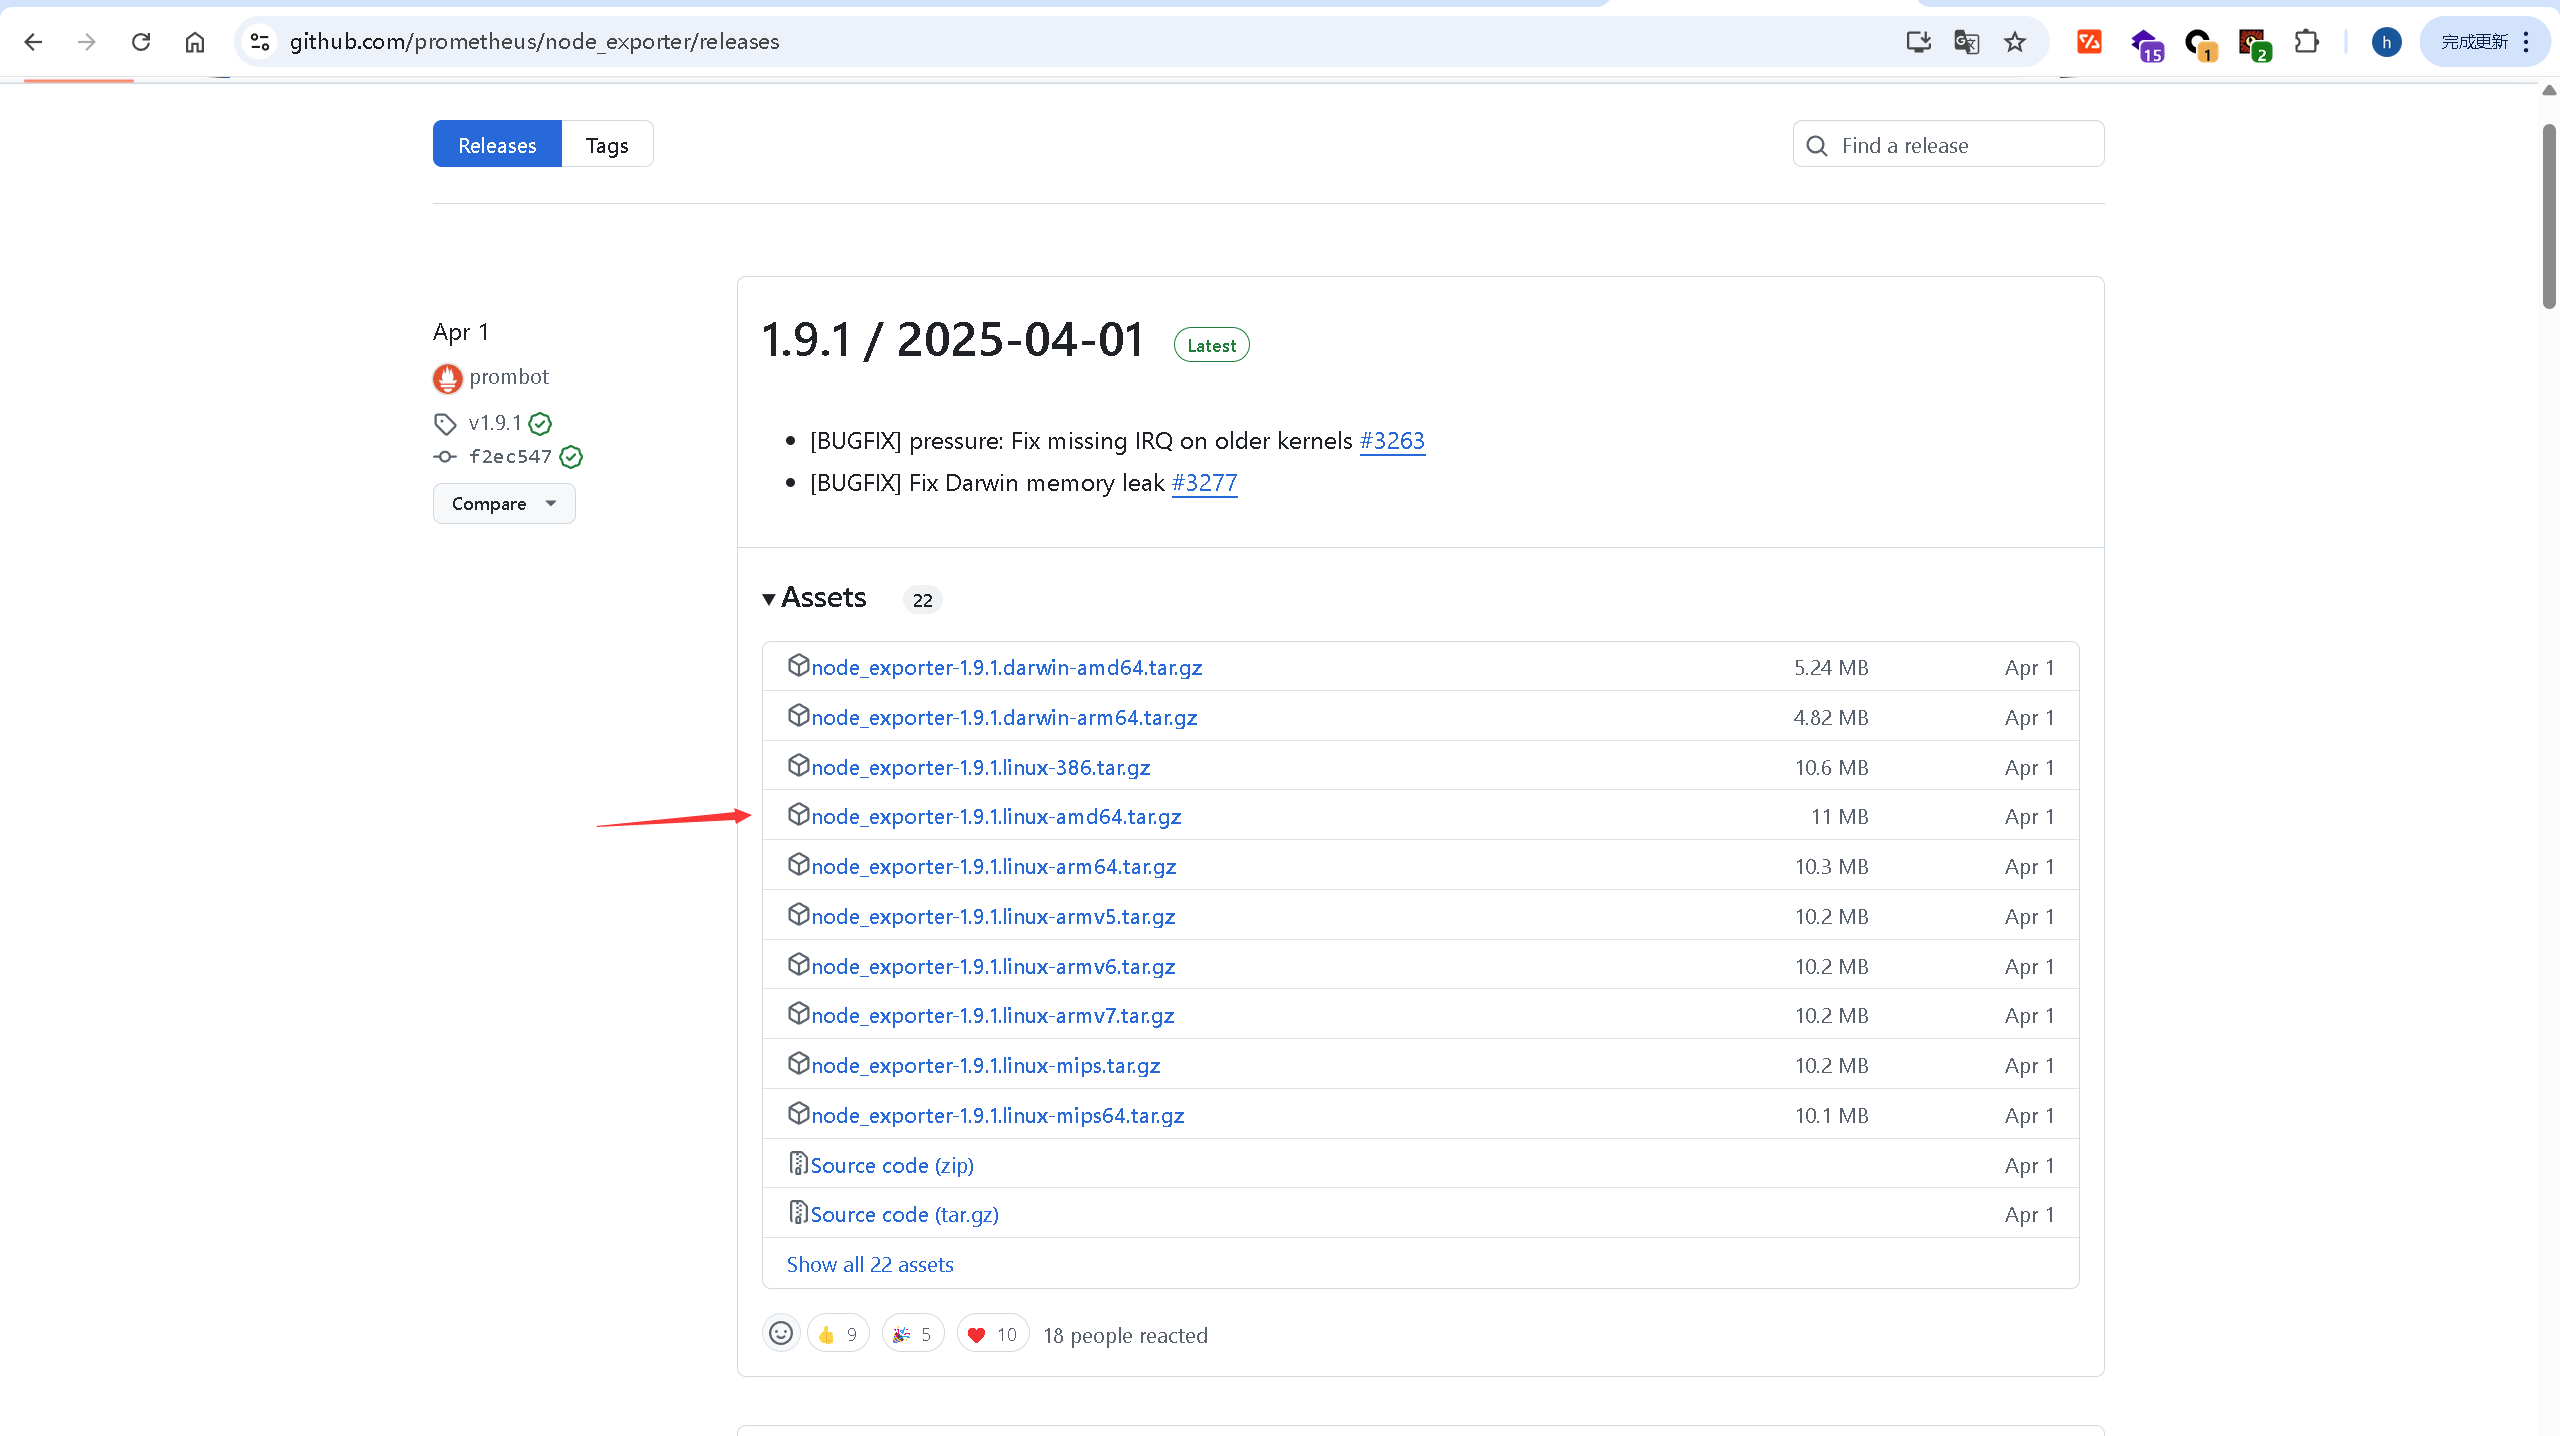
随后通过xshell传入
解压
[root@nginx1 node_exporter]# tar -xzvf node_exporter-1.9.1.linux-amd64.tar.gz
将node_exporter下二进制文件拷贝到/usr/local/bin目录下并设置权限
[root@nginx1 node_exporter]# cd node_exporter-1.9.1.linux-amd64/
[root@nginx1 node_exporter-1.9.1.linux-amd64]# cp node_exporter /usr/local/bin/
[root@nginx1 node_exporter-1.9.1.linux-amd64]# ll /usr/local/bin/ | grep node
-rwxr-xr-x. 1 root root  22204245 7月   2 16:53 node_exporter
# 设置权限
[root@nginx1 node_exporter-1.9.1.linux-amd64]# chown node_exporter.node_exporter /usr/local/bin/node_exporter
# 查看权限设置是否成功
[root@nginx1 node_exporter-1.9.1.linux-amd64]# ll /usr/local/bin/node_exporter
-rwxr-xr-x. 1 node_exporter node_exporter 22204245 7月   2 16:53 /usr/local/bin/node_exporter
启动
# 可直接启动(非后台启动),进入node_exporter安装目录
./node_exporter

# 后台启动,在安装目录下:
nohup ./node_exporter &
# 后台启动,在任意目录下:
nohup /usr/local/bin/node_exporter &

我们这里使用后台启动。
[root@nginx1 node_exporter-1.9.1.linux-amd64]# nohup /usr/local/bin/node_exporter &
[1] 97370
[root@nginx1 node_exporter-1.9.1.linux-amd64]# nohup: 忽略输入并把输出追加到"nohup.out"

[root@nginx1 node_exporter-1.9.1.linux-amd64]# ps aux | grep node_exporter
root      97370  0.0  0.3 1240860 7320 pts/2    Sl   16:55   0:00 /usr/local/bin/node_exporter
root      97395  0.0  0.0 112824   980 pts/2    S+   16:55   0:00 grep --color=auto node_exporter


# 查看9100端口是否被监听
[root@nginx1 node_exporter-1.9.1.linux-amd64]# netstat -ntlp | grep :9100
tcp6       0      0 :::9100                 :::*                    LISTEN      97370/node_exporter
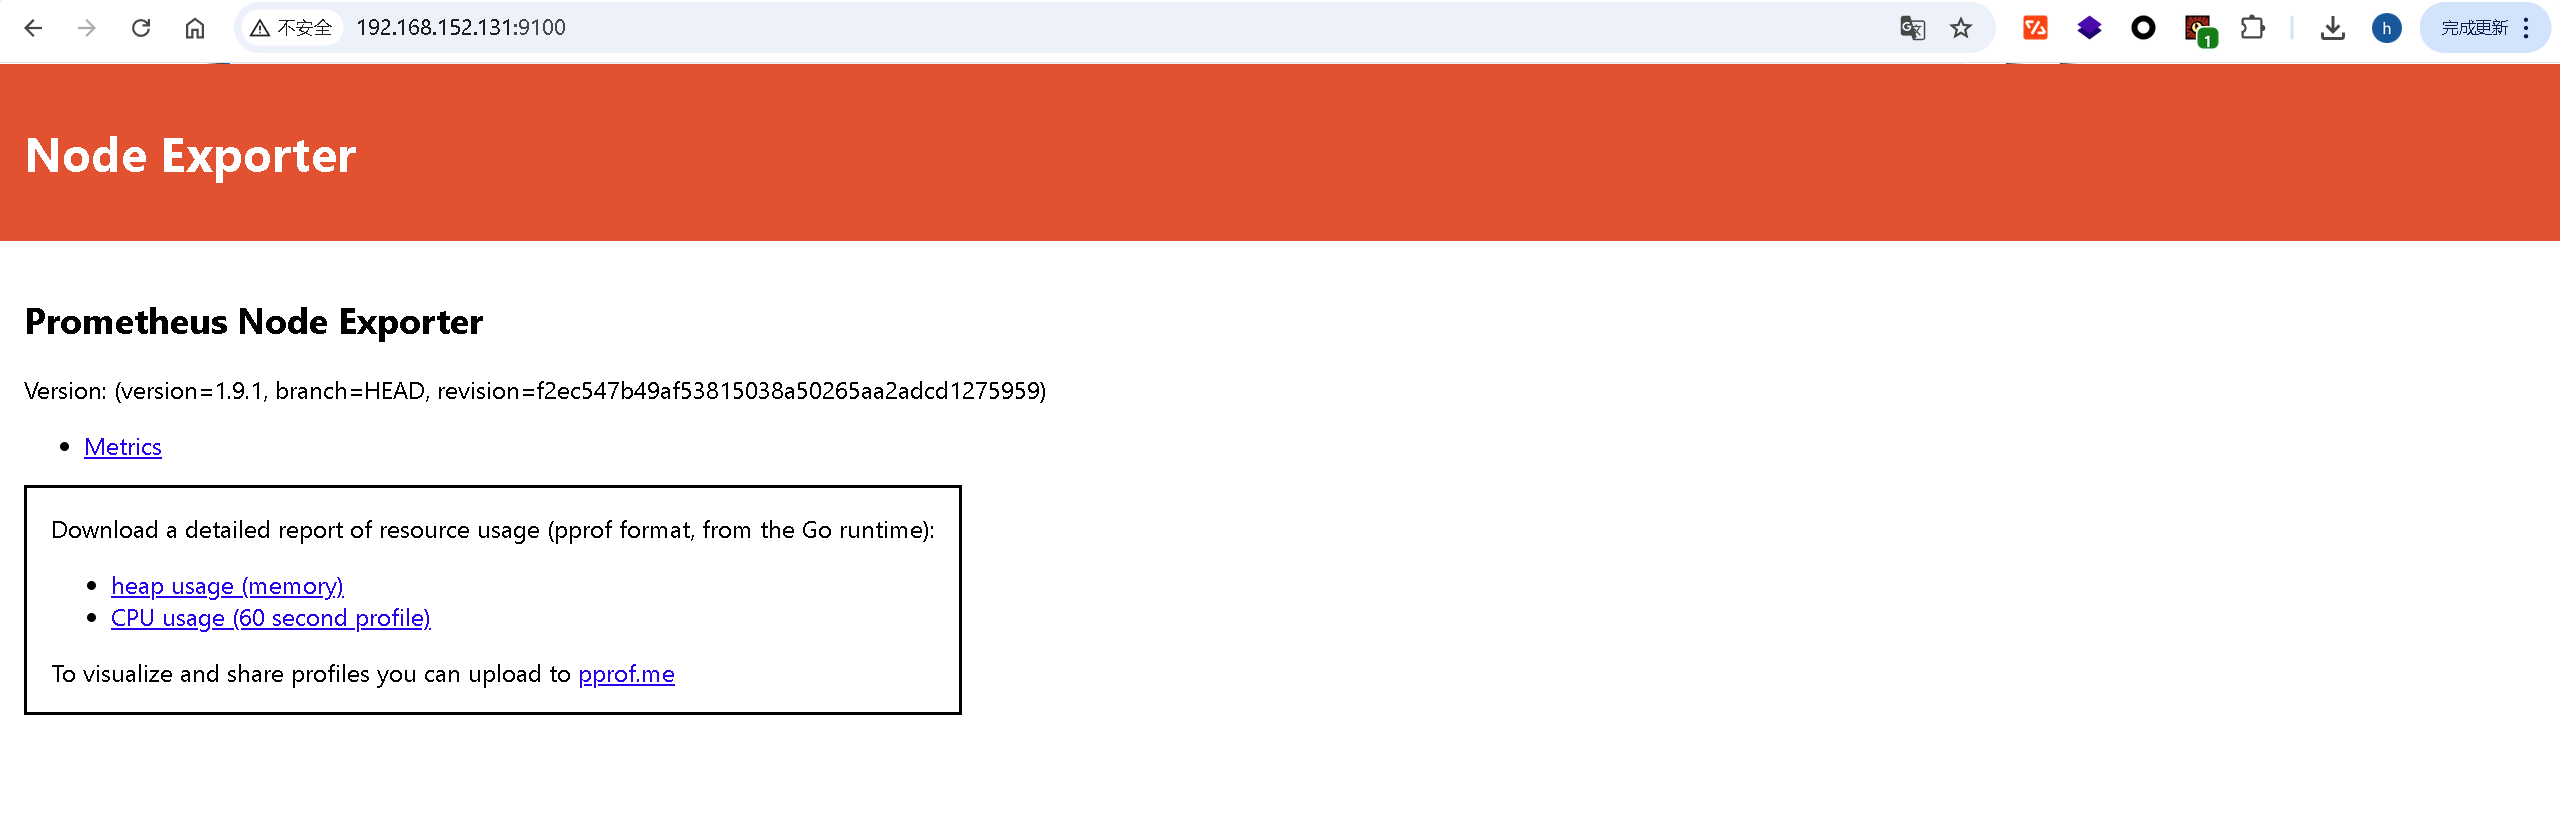
说明启动成功,在浏览器上输入ip + 9100端口可访问。(如果有防火墙,需要设置)
将node_exporter加入systemctl管理
[root@nginx1 node_exporter-1.9.1.linux-amd64]# vim /etc/systemd/system/node_exporter.service

[Unit]
Description=node_exporter
After=network.target

[Service]
User=node_exporter
Group=node_exporter
Type=simple
ExecStart=/usr/local/bin/node_exporter
PrivateTmp=true
RestartSec=5
StartLimitInterval=0
Restart=always

[Install]
WantedBy=multi-user.target
重新加载服务列表
[root@nginx1 node_exporter-1.9.1.linux-amd64]# systemctl daemon-reload
启动服务
# 停止上面手动后台启动的node_exporter进程
[root@nginx1 node_exporter-1.9.1.linux-amd64]# ps aux | grep node_exporter
root      97370  0.0  0.4 1240860 7580 pts/2    Sl   16:55   0:00 /usr/local/bin/node_exporter
root      97845  0.0  0.0 112824   984 pts/2    S+   17:00   0:00 grep --color=auto node_exporter
[root@nginx1 node_exporter-1.9.1.linux-amd64]# kill -9 97370

# 检查是否还存在node_exporter进程
[root@nginx1 node_exporter-1.9.1.linux-amd64]# ps aux | grep node_exporter
root      97893  0.0  0.0 112824   984 pts/2    S+   17:01   0:00 grep --color=auto node_exporter
[1]+  已杀死               nohup /usr/local/bin/node_exporter

# 查询所有服务单元是否有node_exporter
[root@nginx1 node_exporter-1.9.1.linux-amd64]# systemctl list-unit-files | grep node_exporter
node_exporter.service                         disabled

# 存在,且非开启自启动,接着使用systemctl启动node_exporter服务
[root@nginx1 node_exporter-1.9.1.linux-amd64]# systemctl start node_exporter

# 查看node_exporter服务状态
[root@nginx1 node_exporter-1.9.1.linux-amd64]# systemctl start node_exporter

将node_exporter设置为开机自启动
[root@nginx1 node_exporter-1.9.1.linux-amd64]# systemctl enable node_exporter
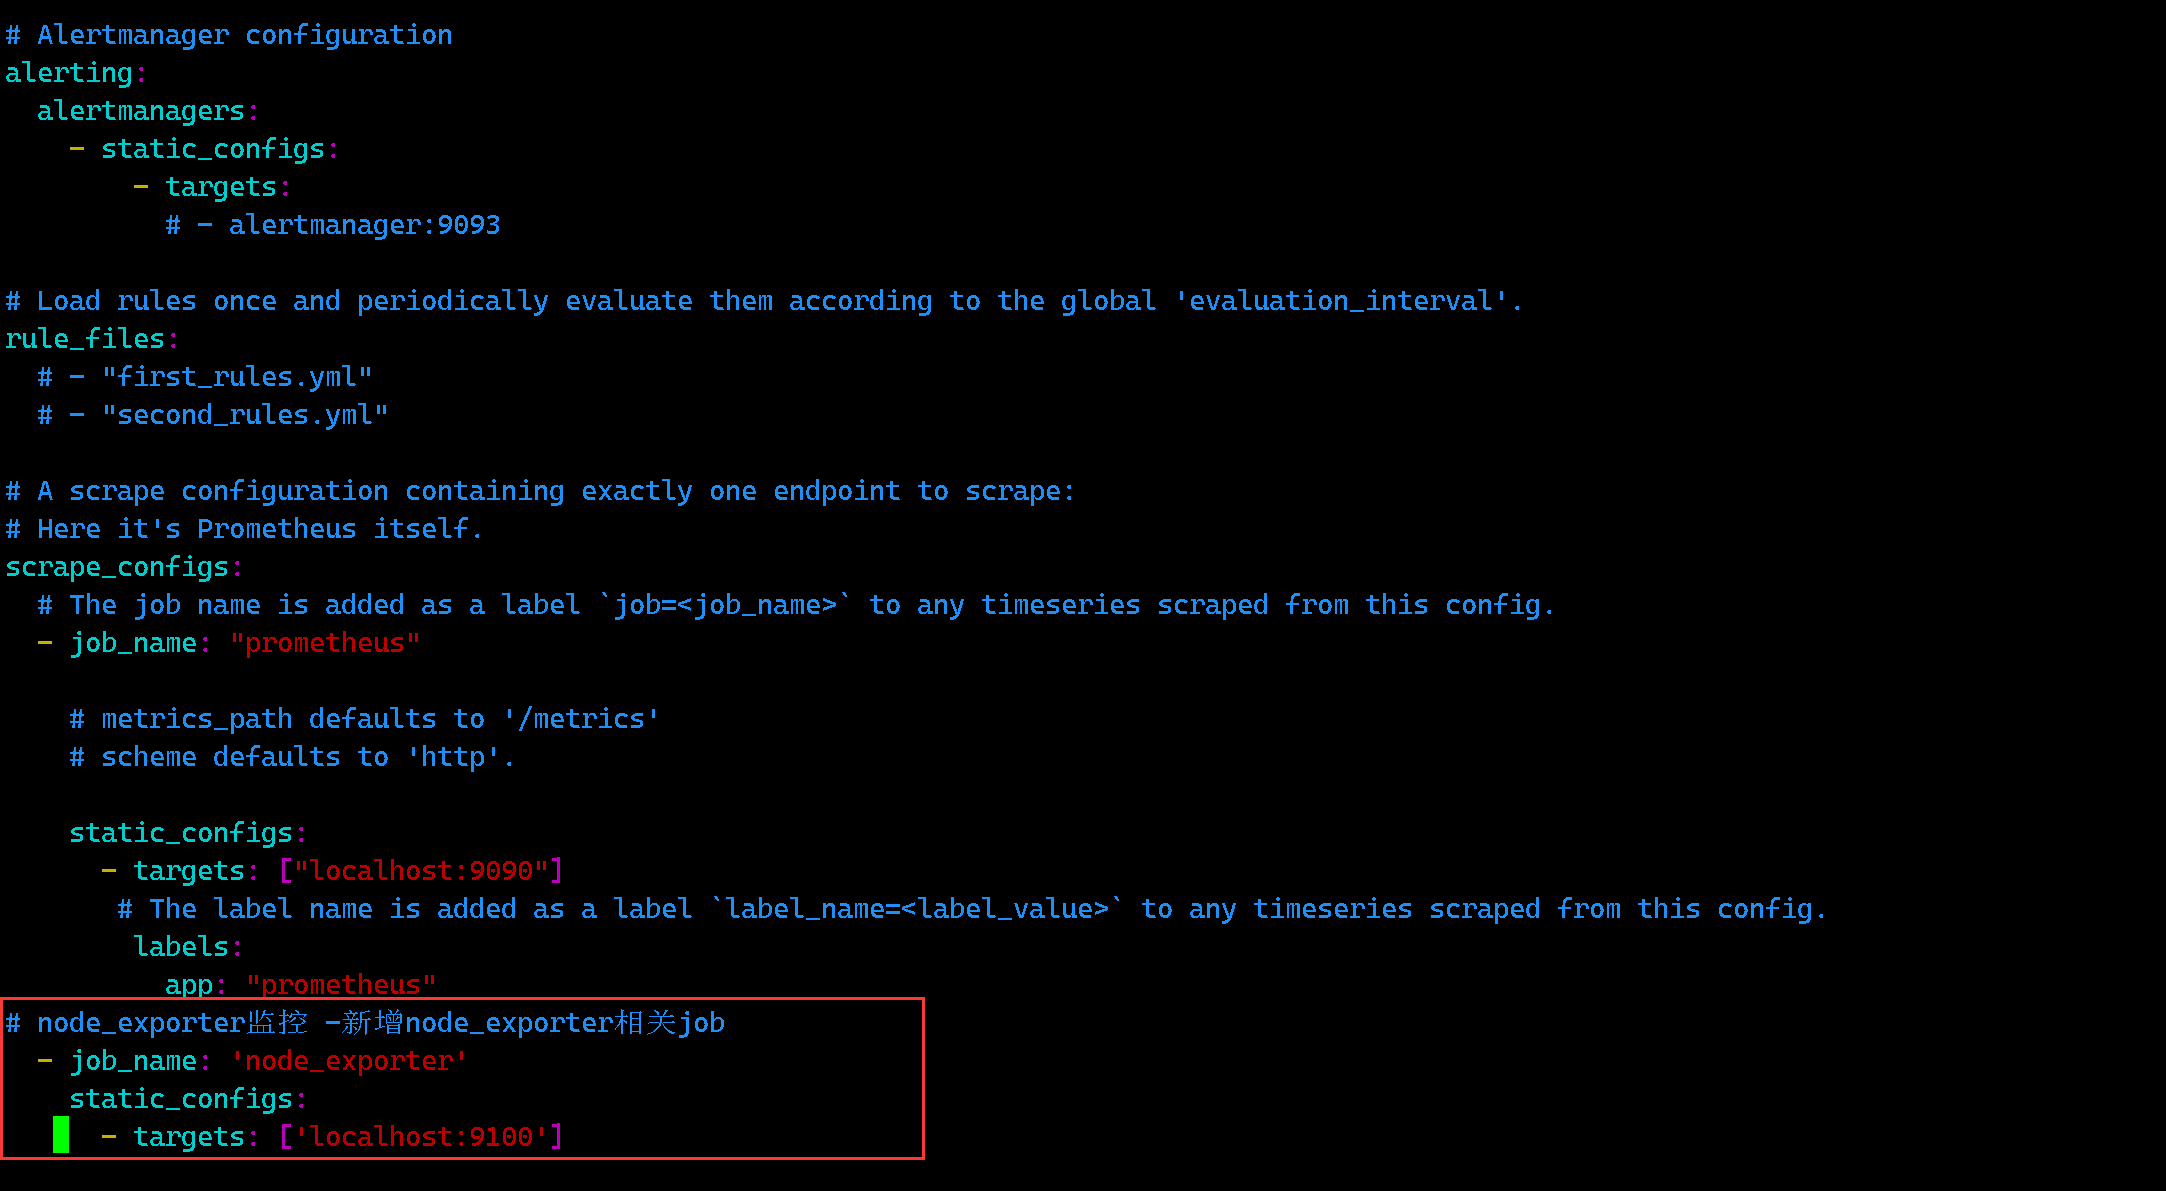
加入prometheus监控
[root@dxm22 node_exporter-1.0.1.linux-amd64]# vim /etc/prometheus/prometheus.yml
# 增加如下内容:
# node_exporter监控 -新增node_exporter相关job
  - job_name: 'node_exporter'
    static_configs:
    - targets: ["localhost:9100"]
注意缩进格式必须正确
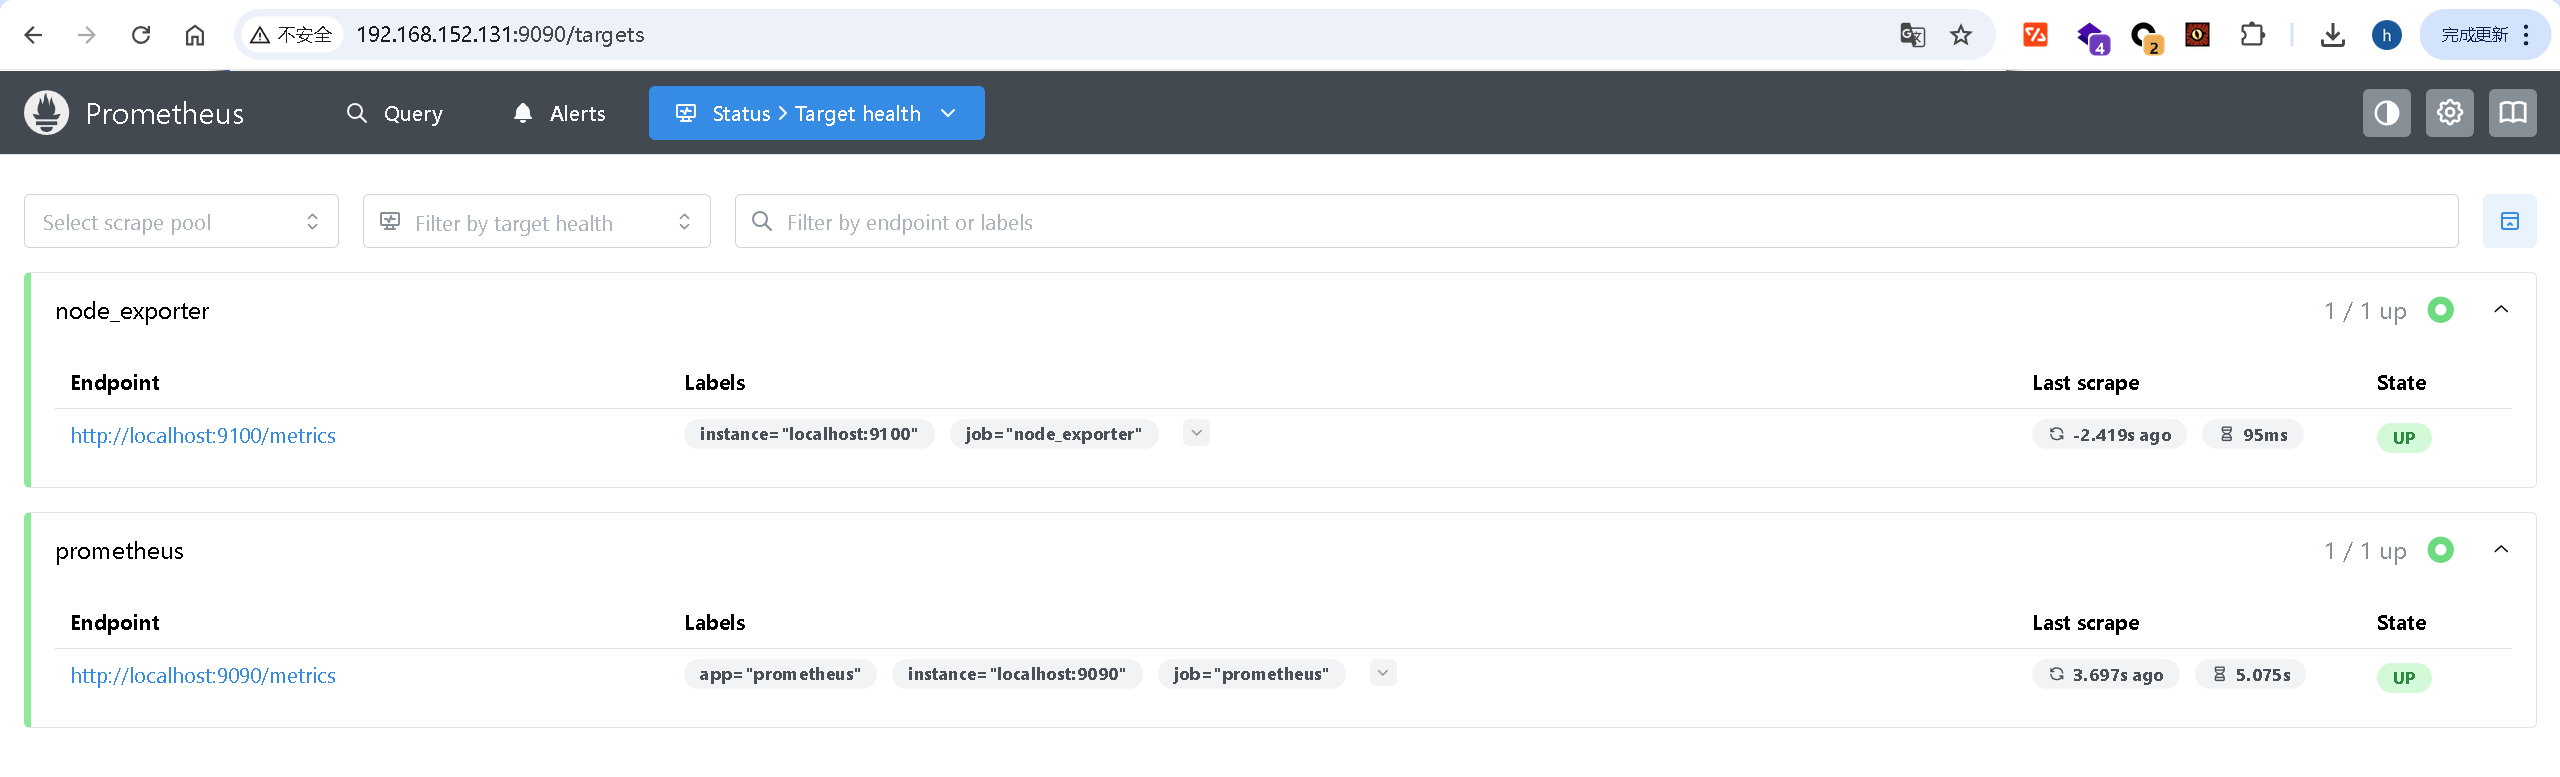
重启prometheus
[root@nginx1 node_exporter-1.9.1.linux-amd64]# systemctl restart prometheus
再次访问http://192.168.152.131:9090/targets。
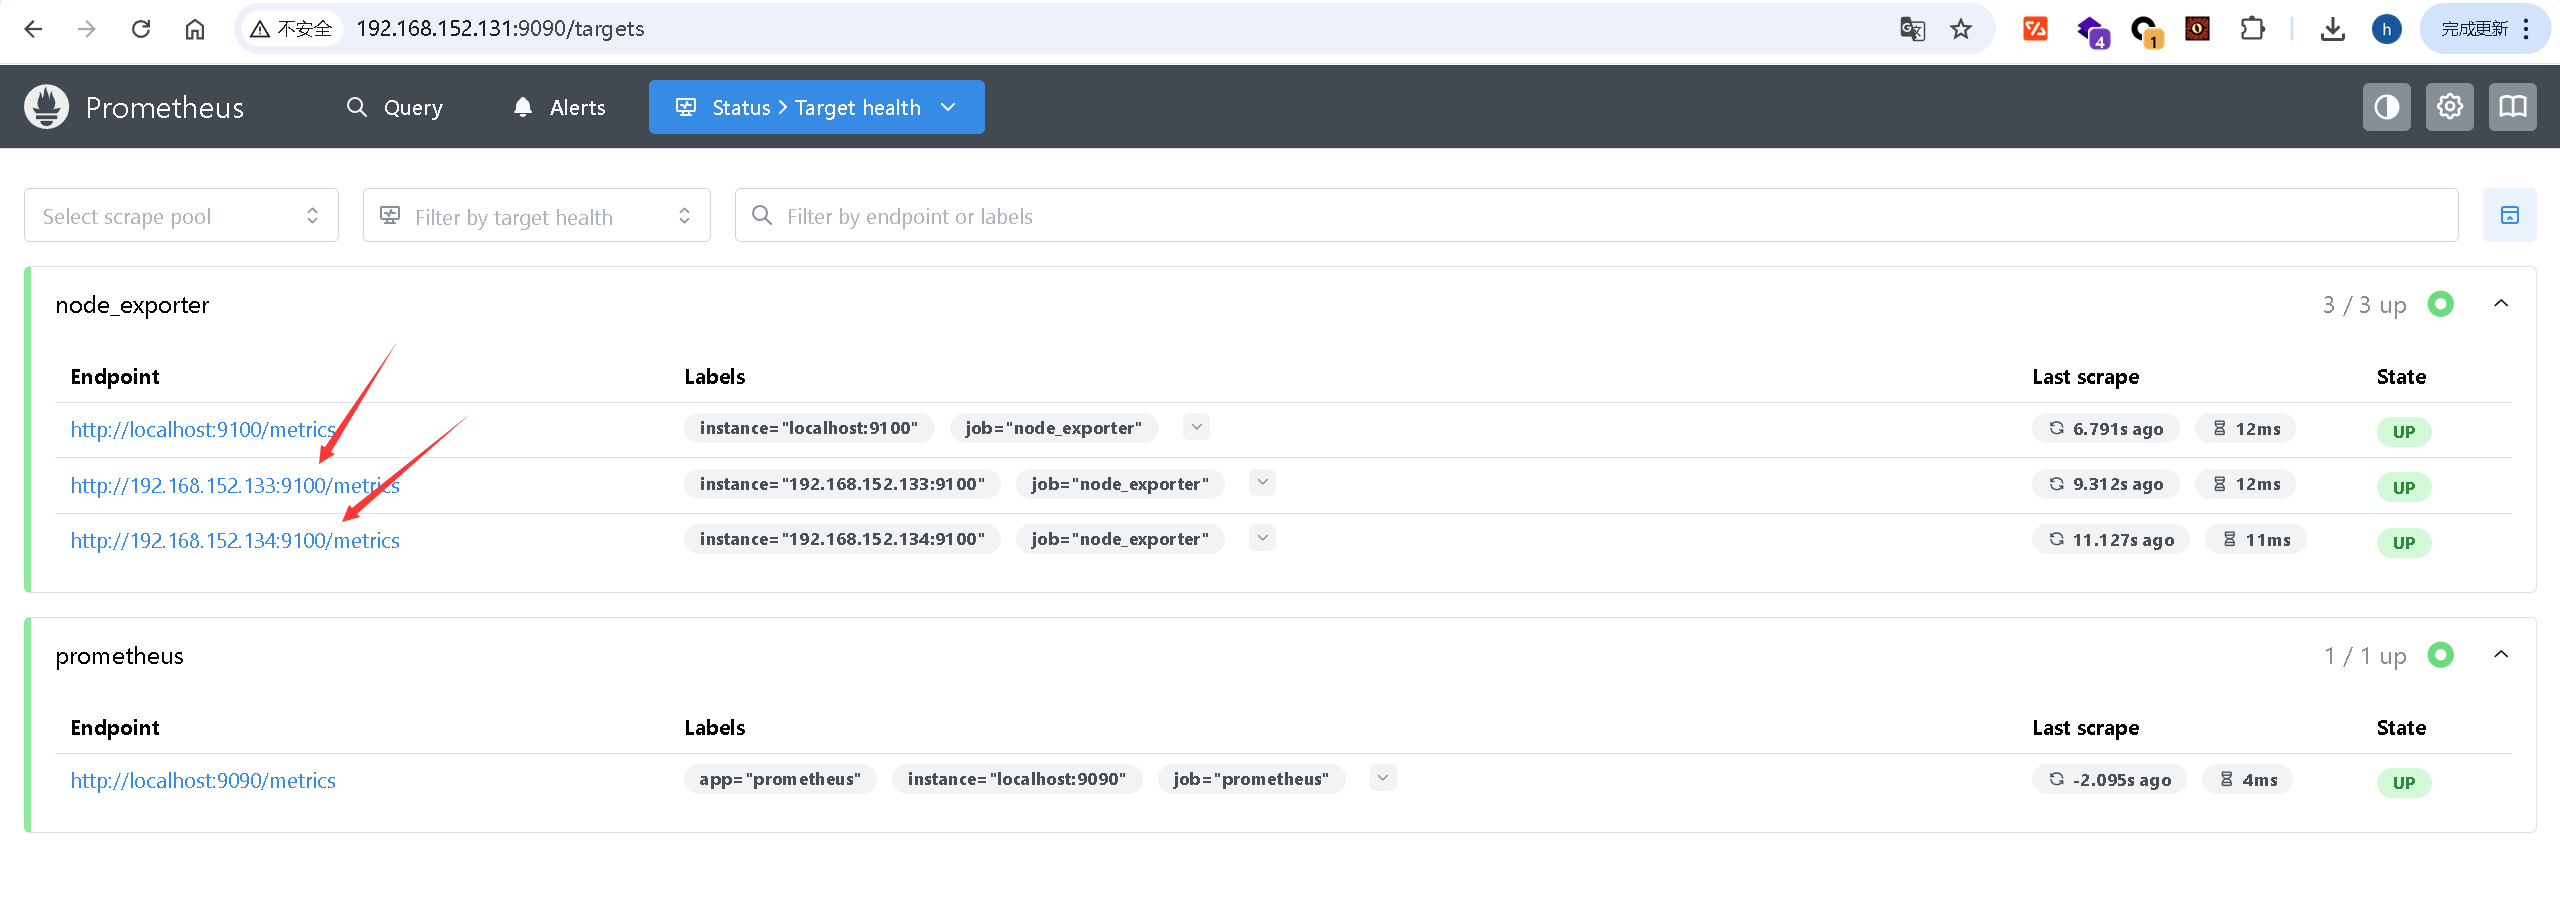
3.通过node_Exporter监控两台服务器
3.1.给两台服务器(192.168.152.133和192.168.152.134)安装node_exporter
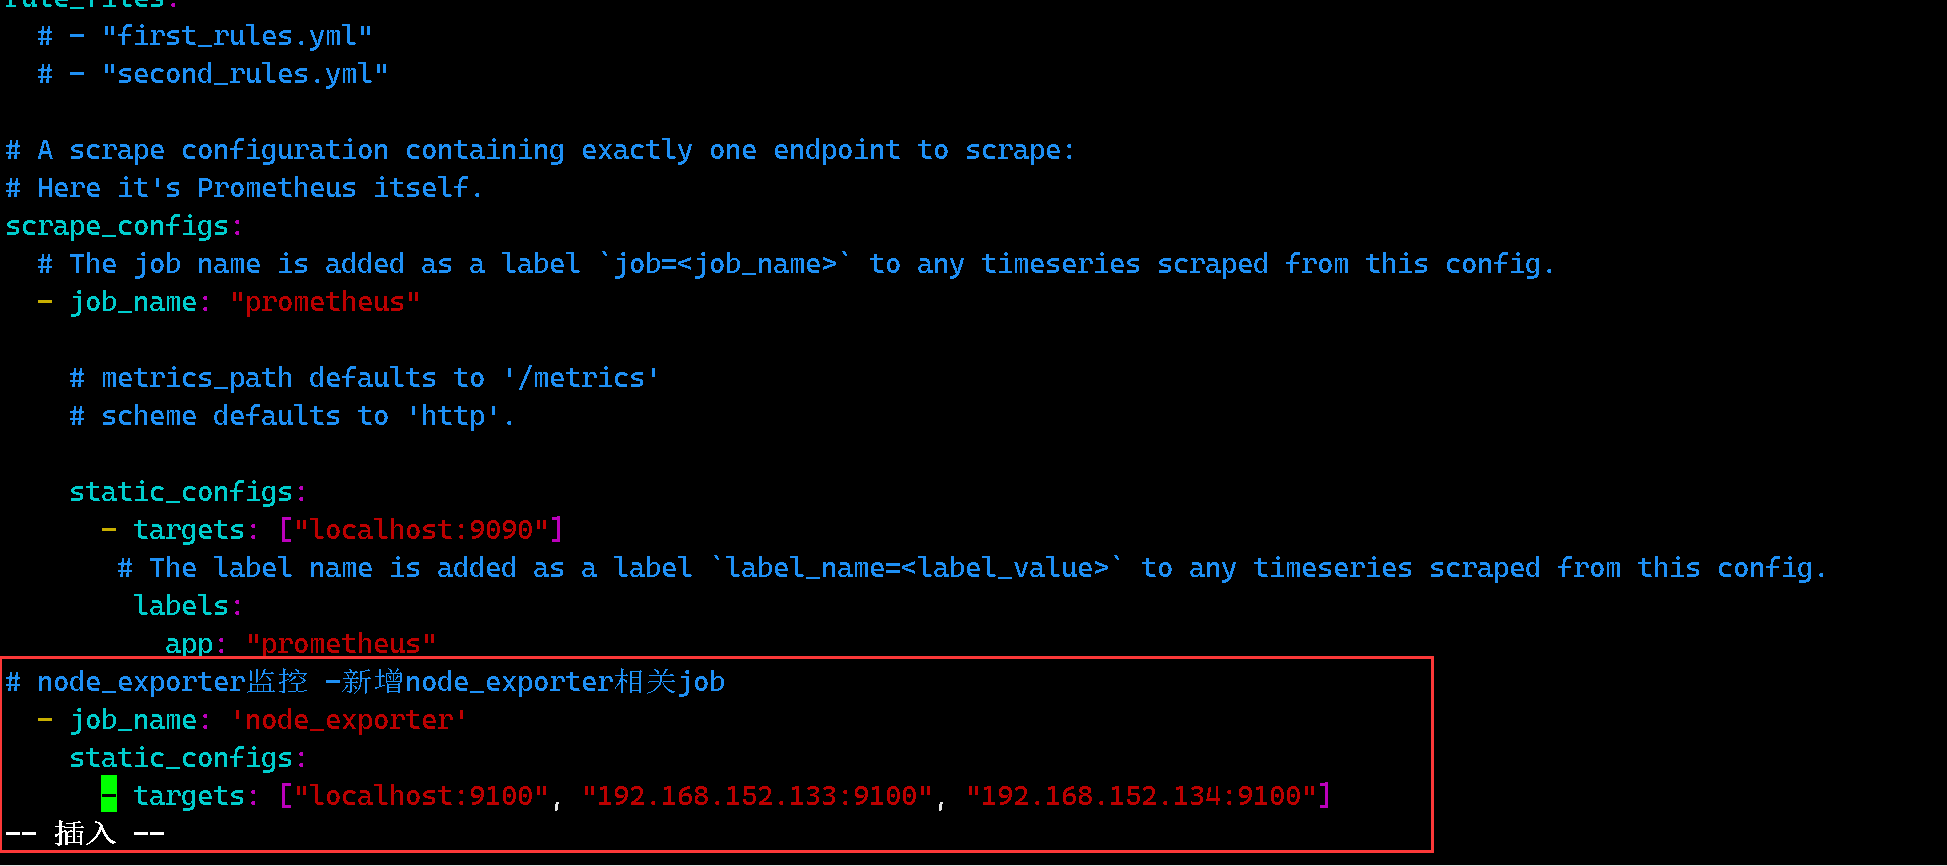
3.2.修改Prometheus配置文件
在 scrape_configs 部分添加两个目标 IP
scrape_configs: - job_name: "prometheus" static_configs: - targets: ["localhost:9090"] - job_name: "node_exporter" static_configs: - targets: ["localhost:9100", "192.168.152.133:9100", "192.168.152.134:9100"]
3.3.重启Prometheus服务
[root@nginx1 node_exporter-1.9.1.linux-amd64]# systemctl restart prometheus
3.4.验证
访问192.168.152.131:9090